Uber metrics: key benchmarks for PM interviews
|
|
|
If you're interviewing for product management roles at Uber, a key step in your preparation should be understanding the core trends in their business.
To help, we've assembled an Uber data pack, sourced from financial leaks to the WSJ, Uber's own press releases and announcements and industry coverage. NOTE: The numbers below are estimates, built off of the best publicly available information coupled with our extrapolation.
- Gross bookings trends (est), from Q4 2014 to Q4 2018
- Net revenues trends (est), from Q4 2014 to Q4 2018
- Rides per day (est), from Q4 2014 to Q4 2018
- Partner revenue share (est), from Q1 2017 to Q2 2018
- Revenue per ride (est), from Q4 2014 to Q4 2018
- Uber Eats gross bookings, from 2010 to 2018
Why does knowing the Uber metrics help in PM interviews?
No one is going to ask you a direct question about a metric (e.g., "What was Uber's net revenue in 2018?").
However, it's very likely that certain interview questions will require familiarity with the nature of Uber's operations and scale.
For example, consider the following potential Uber PM interview questions:
- How many rides do you estimate Uber does in Asia per day?
- How would you design a lost item retrieval system for Uber riders?
- How could Uber grow net revenue per ride by 10%?
In each of the aforementioned interview questions, understanding key Uber metrics helps tremendously.
For example, if you didn't know that Uber was doing roughly 20M rides daily, it would be. tough to sanity check an estimate of daily rides in Asia! Similarly, if you didn't know Uber netted ~$2 in revenue per ride, you'd have no context to understand whether a 10% increase meant driving a $0.20 or a $2.00 per ride increase.
Timeline of Uber's major product launches and regional expansion
First, let's start by setting context and reviewing how Uber has grown over the past decade.
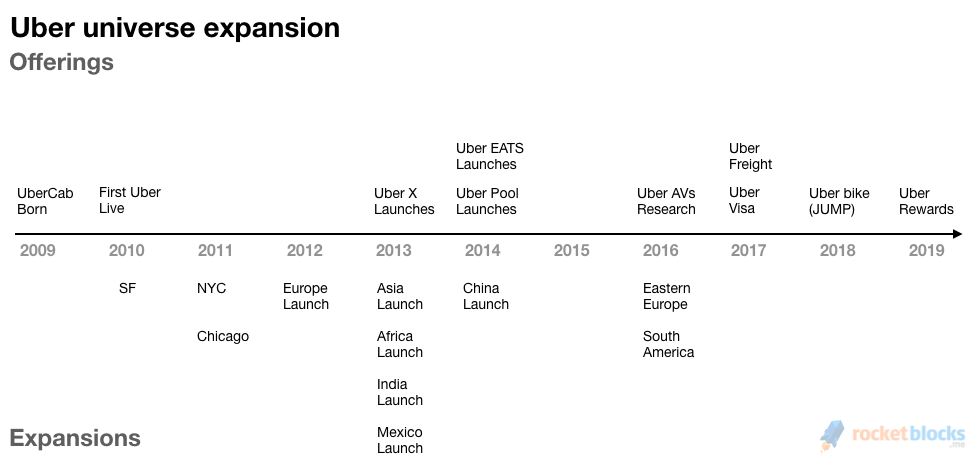
In terms of product launches, one key thing jumps out: the first five years were almost exclusively focused on launching and scaling the original Uber service (what's now called Uber Black), with the 2nd key launch of Uber X coming only at the tail end of this period.
On the regional expansion front, the picture is inverted. Uber expanded aggressively in the early years, going from US only in it's first year live to operating in North America, Europe, Asia and India just three years later.
Estimated Uber gross bookings and net revenues
Let's start by looking at Uber's top live bookings and revenue growth.
Gross bookings represents the total dollar value that Uber charged its customers (e.g., sum up all the ride bills). Net revenue is Uber's final cut of that after the partner's share (the driver) is removed, along with promotions, incentives and refunds.
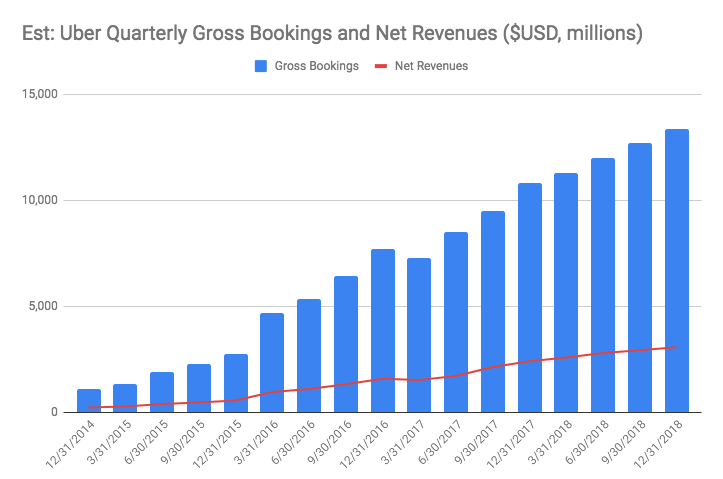
Uber bookings and revenue take aways:
- Uber's booking and revenue growth is impressive. They've gone from booking roughly $1B per quarter in Q4 2014 to $13B+ - that's a staggering 13X in 4 years!
- Uber's revenue growth is keeping pace - meaning the company hasn't given away an increasing percentage of bookings to fuel that growth.
- Putting revenue growth in perspective, Uber's 2018 revenue of ~$10B, is about 1/5 the size of Facebook 2018 revenues.
Got an Uber interview?
"RocketBlocks was a perfect interview tool during hectic recruiting seasons. I could quickly do it for 20-30 mins between my prep or if I had more time I could deep dive into some of the larger exercises. It does a great job throughout." - Anirudha Nandi, Uber APM, Ivey HBA Grad
Estimated Uber rides per day
Next, let's look at Uber's core offering: rides.
This gives us a sense of consumer demand for Uber's core product and, importantly, their ability to fulfill that demand successfully.
To do this, we look at the series of ride milestones (both daily and cumulative) Uber has announced over the years. For example, in Q4 2014, they annoucned they hit 1M rides per day and, in Q2 2017, they annoucned a cumulative 5B rides completed. Using all the pubic announcements, one can triangulate a growth curve of Uber rides per day over the last four years and look at the growth.
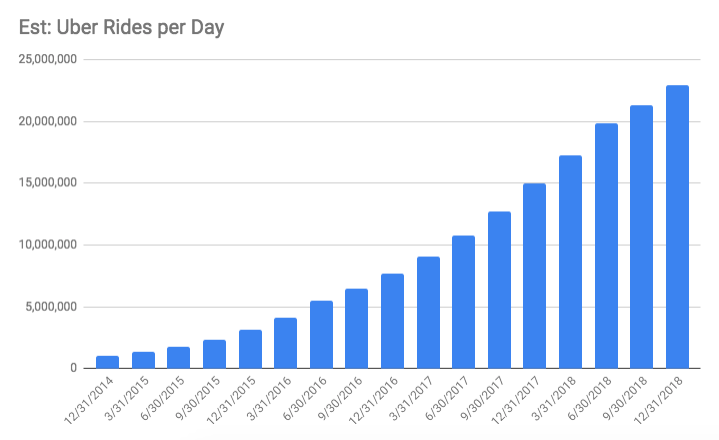
Key takeaways from Uber's rides per day
- Rides per day growth over the last 4 years has been explosive - growing 20X in the last 4 years from 1M to 20M.
- Major setbacks in Uber's history, such as exiting the China market, don't seem to have put any noticeable dent in rides per day growth.
- Given that Uber has long argued that profitability will come with scale, what level of rides per day need to be reached for profitability to kick in?
Uber partner share of gross bookings
Now, let's look at the lever that turns bookings into revenue for Uber: the percentage of bookings that goes to drivers.
Here, we're looking at actual data from leaked financials to the WSJ for a little over a year period, which shows what percentage of gross bookings was going to drivers.
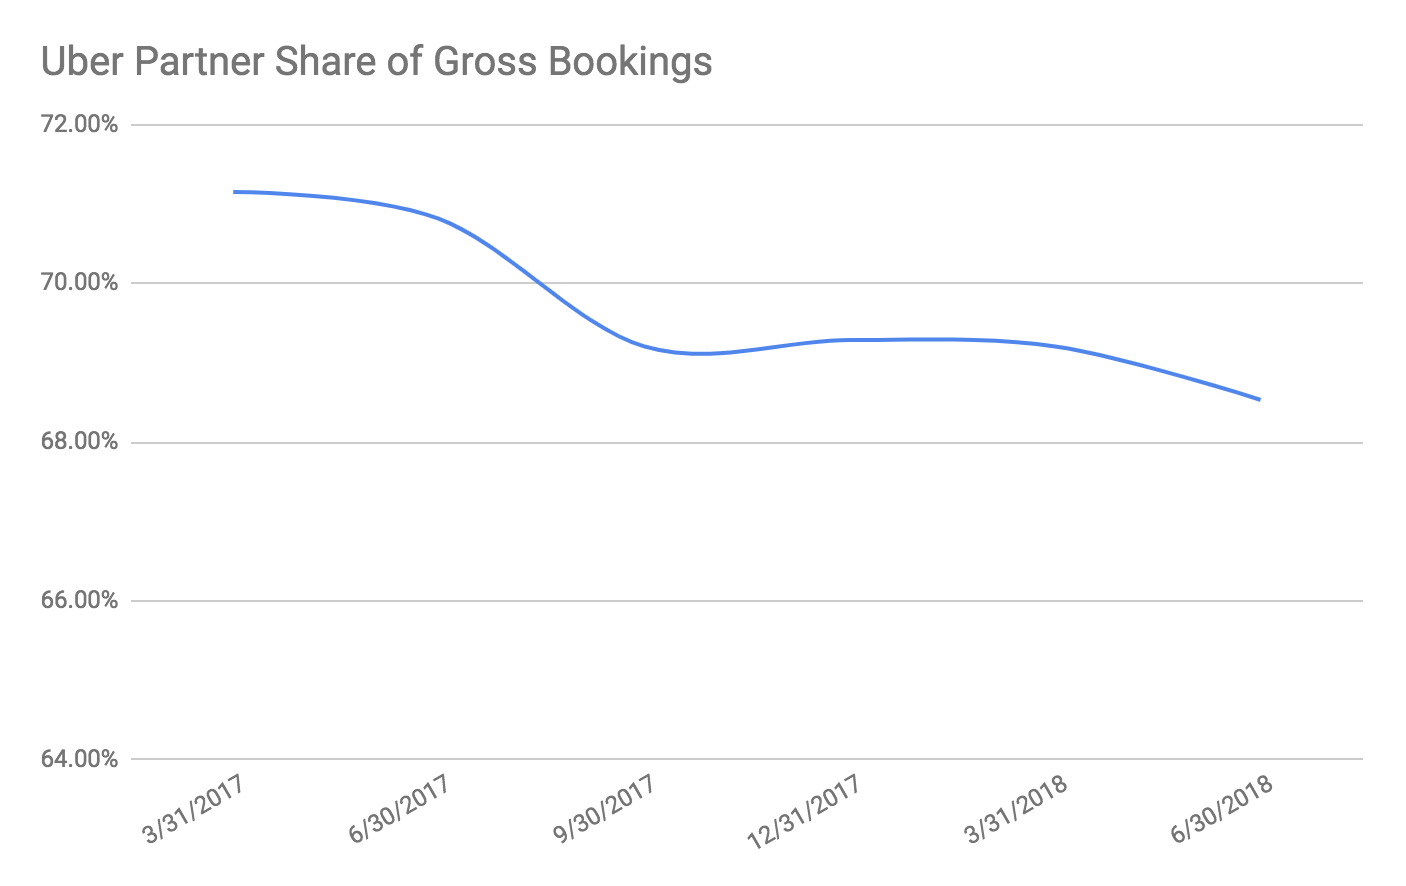
Key insights from Uber's partner share
- Uber appears to be slowly reducing the share of bookings going directly to drivers - this is likely driven by an effort to reach profitability ahead of an eventual IPO.
- Overall, the size of the "rake," the percentage Uber takes of each ride (around ~30%) is higher than other on-demand players like Airbnb, which take ~12% (comps available here).
Estimated Uber net revenue per ride
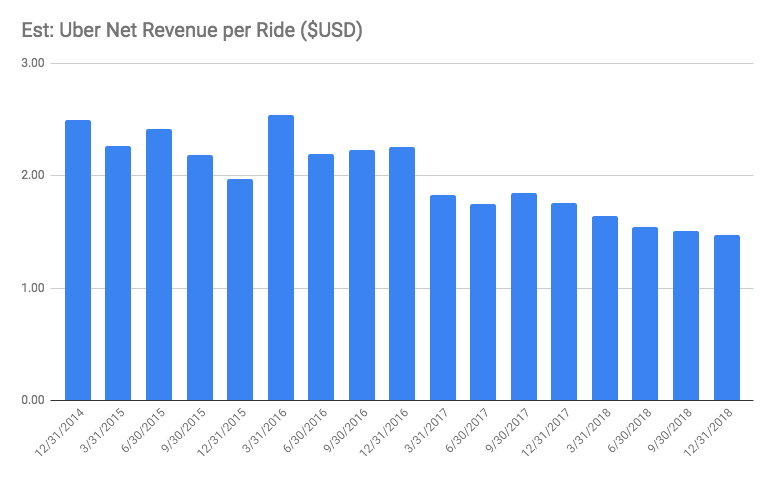
Given the high-scale business Uber is in, it's interesting to look at how much revenue they pull in per ride. Note that since the number of rides per day and net revenue are estimated, the following analysis serves only as directional guidance, not a precise forecast.
Key takeaways on revenue per ride
- Net revenue per ride has declined over the last four years pretty consistently
- It's possible that this decline is driven by an increased adoption of cheaper Uber alternaties, like Uber Pool and Uber Pool Express which launched in late 2014
- Finally, given the overall revenue numbers available for Uber don't back out the Uber EATS contribution, it's possible the decline is overstated.
The Uber EATS caveat
Finally, there is one last important topic: Uber EATS.
Reliable estimates are tough to find, but the few data points available suggest EATS is developing into a robust business for Uber.
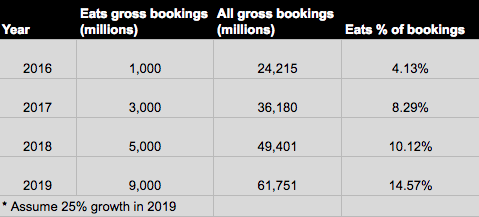
- EATS is growing at massive clip and is becoming a meaningful part of the overall Uber business, at least from a gross bookings perspective.
- It seems clear from the bookings growth that EATS has proven Uber can leverage its logistics network into areas outside of shuttling people from point A to point B.
- Given that Uber EATS is likely now a meaningful part of overall bookings (10%+), readers should be cogniscent of the impact that could have on aforementioned estimates.
P.S. Are you preparing for PM interviews?
Real interview questions. Sample answers from PM leaders at Google, Amazon and Facebook. Plus study sheets on key concepts.
Data sources
- Wall Street Journal, Uber Financials table
- Uber.com Newsroom, milestones and company info
- TechCrunch, Lyft and Uber rides per day
- Recode, Uber announces four billion total rides
- Recode, New Uber CEO Dara Khosrowshahi at Code Conference
- Business Insider, Uber EATS set for $3B in annual bookings in 2017
- Timeline of Uber (funding, launches, events), Wikipedia


