Slack metrics: helpful benchmarks for understanding Slack
|
|
|
Slack is one of the most interesting and promising SaaS software companies. And it's positioned well as a new new commmunications operating system for the modern workplace. Slack already serves 1B+ messages a week and is quickly gaining adoption at the world's most successful companies (as well as almost every new startup).
As a result, it's a fun company for any aspiring (or current) product managers to study up on. Below, we've assembled a data pack of core Slack engagement, retention and monetization metrics. If you're going through product management interviews at SaaS companies (or even Slack itself), hopefully these metrics can serve as helpful benchmarks when you're preparing.
Data in this post came from Slack S-1 filing, Slack's PR filings and other publicly available SaaS metrics. Occasional assumptions are made and cited where public data is not available.
Key Slack metrics covered:
- Slack, key metrics overview
- Daily average users and YoY Growth(%), from 2014 to 2019
- Paying customers, $100K customers, from 2017 to 2019
- Net dollar retention rate (NDRR), from 2017 to 2019
- NDRR explanation, based off Slack's S-1 numbers
SaaS metrics and their relevance to product management interviews
Consider the following questions that might come up in a product management interview for a SaaS company:
- What features would you launch to improve net dollar retention rate (NDRR)?
- How would you prioritize asks of our largest customers (over $100K+ in annual revenue) versus our large base of smaller customers?
- Is our current conversion rate good? What could we do to bump up our free-to-paid conversion rate?
In each of the aforementioned interview questions, understanding key SaaS metrics helps tremendously. Without a baseline of knowledge, you won't 1) understand what average or best-in-class metrics look like and 2) might be caught off guard by specific lingo, terms or metrics that SaaS companies pay close attention to.
Slack, the key metrics overview
To start, it can be helpful to review some "point in time" metrics that Slack has released in advance of their eventual 2019 IPO. Ultimately, these metrics are less helpful for understanding company trajectory; the time series data below will be much more helpful for that.
However, these metrics help crystallize how big Slack has become, despite it's relatively short existence so far. The average paying user spends 90 minutes per day in the product, 1B+ messages flow through it a week and half a million organizations already use the product.

Slack's daily average users (DAU)
Daily average users (DAU) is a common metric that's been popularized by consumer tech companies like Facebook, Twitter and Zynga.
It's far from a perfect metric. However, it provides a helpful proxy of determining the volume of daily engagement and can be helpful to spot high level trends when plotted as a time-series.
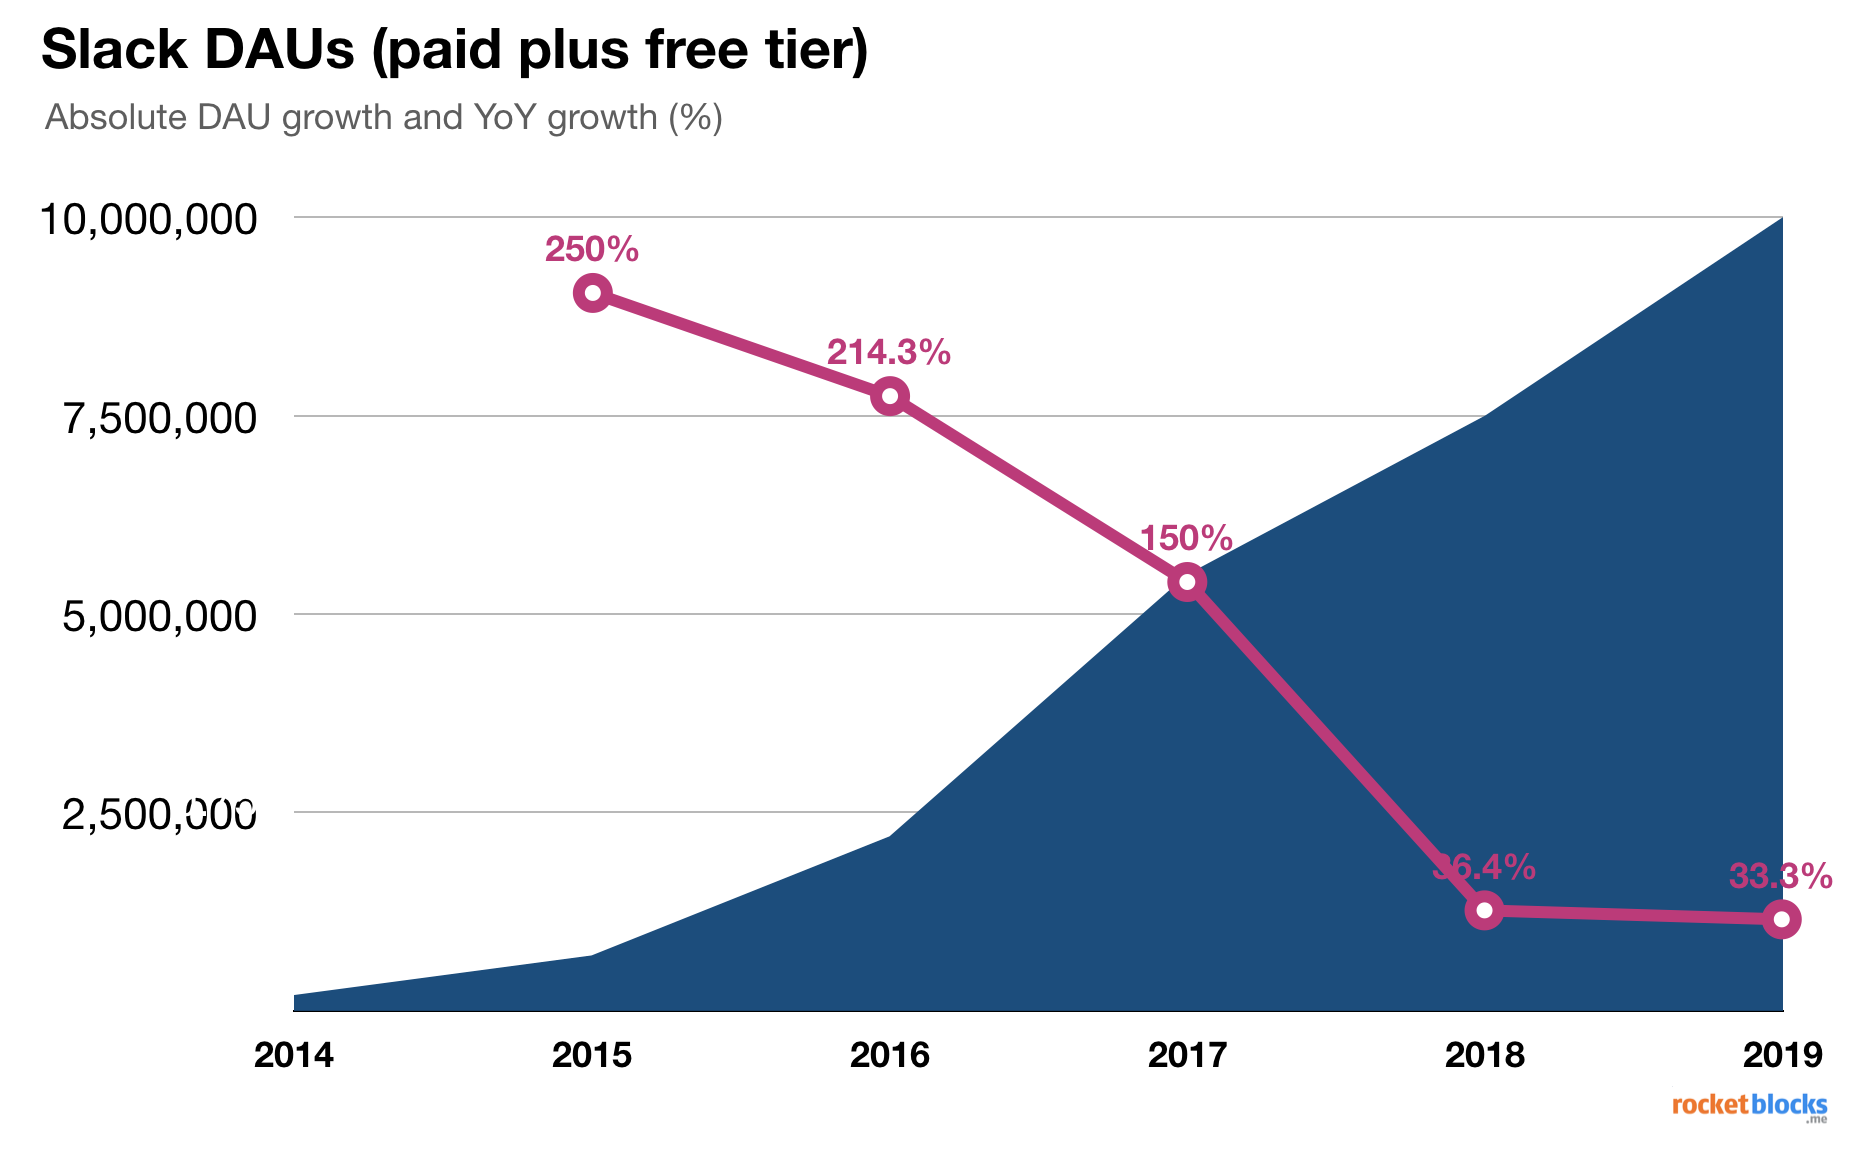
As shown below, Slack's DAU metrics have been incredibly strong - and this reflects two key factors: 1) Slack's adoption amongst tech companies and startup has been rapid and 2) the nature of the product (e.g., workplace communications) is likely to garner high daily adoption, assuming customers like the product.

Slack DAU key take aways:
- The growth of Slack's DAUs is staggering, from well under 1M in 2014 to 10M by 2019, a full 10X jump
- The year-over-year growth rate of DAU has slowed dramatically in the last two years, but that is partly to be expected simply due to the law of large numbers
- While YoY DAU growth rate has slowed, it's also seemed to stabilize in the low 30% range and if Slack could maintain that growth on a base of 10M DAU, that'd be very impressive.
💡 Got a PM interview? Our PM interview drills help get you in top form
Slack's customer breakdown
With businesses like Slack, it's important to go deeper than simple metrics like DAU to get a true sense of truly engaged users and their growth.
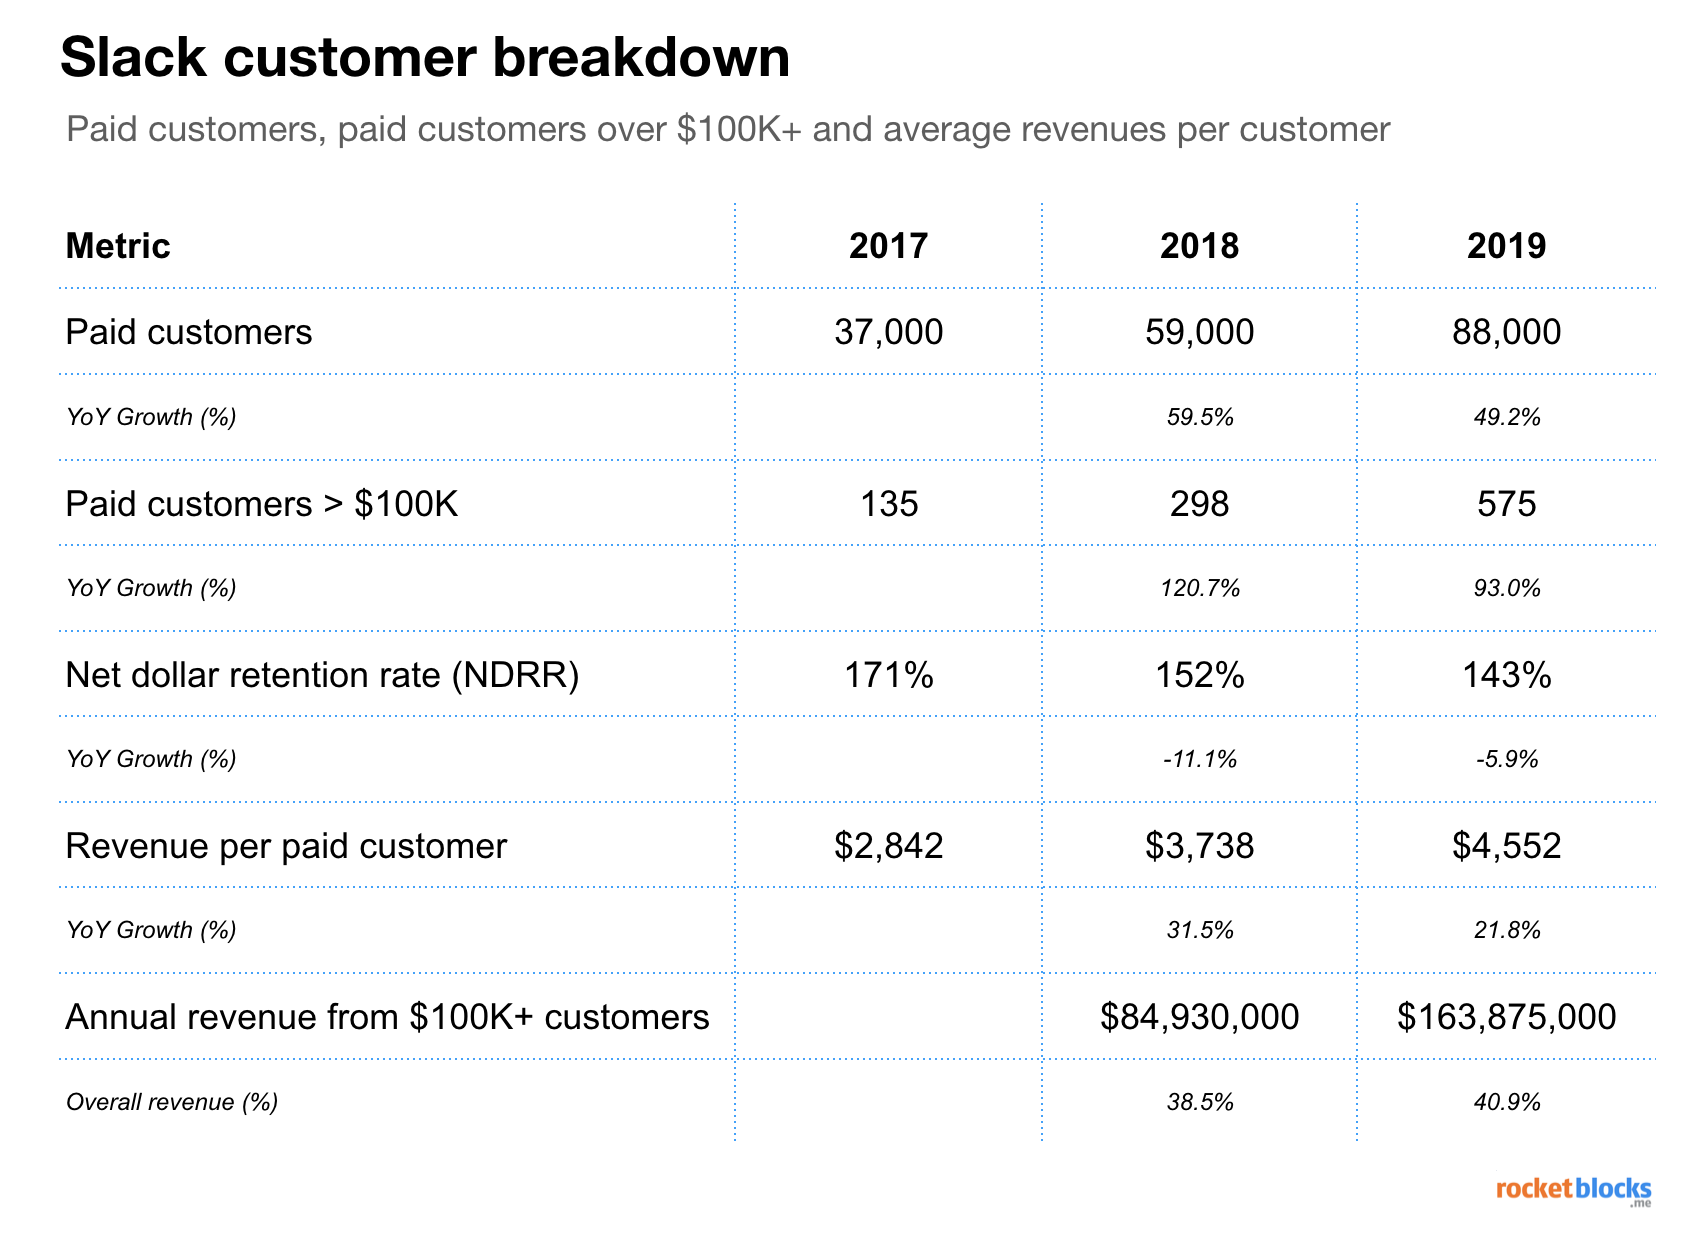
Given Slack's freemium SaaS model, we can look at how many paying customers (e.g., organizations like a company or non-profit) they have and how many major paying customers they have, defined by customers that pay over $100K annually (which is a common SaaS metric).

Key takeaways from Slack's breakdown of paid customers
- Growth in paid customers is healthy, growing at nearly 50% per annum (or more) on top of an already established base in the tens of thousands.
- Growth in $100K+ customers is also quite high, averaging around 100% YoY growth for the three years we've got data
- Net dollar retention rate is falling, which is not ideal, but the rate of deceleration is at least slowing down
- Revenue concentration is moderate, with Slack's largest customers accounting for just over 40% of total revenue
Slack's net dollar retention rate (NDRR)
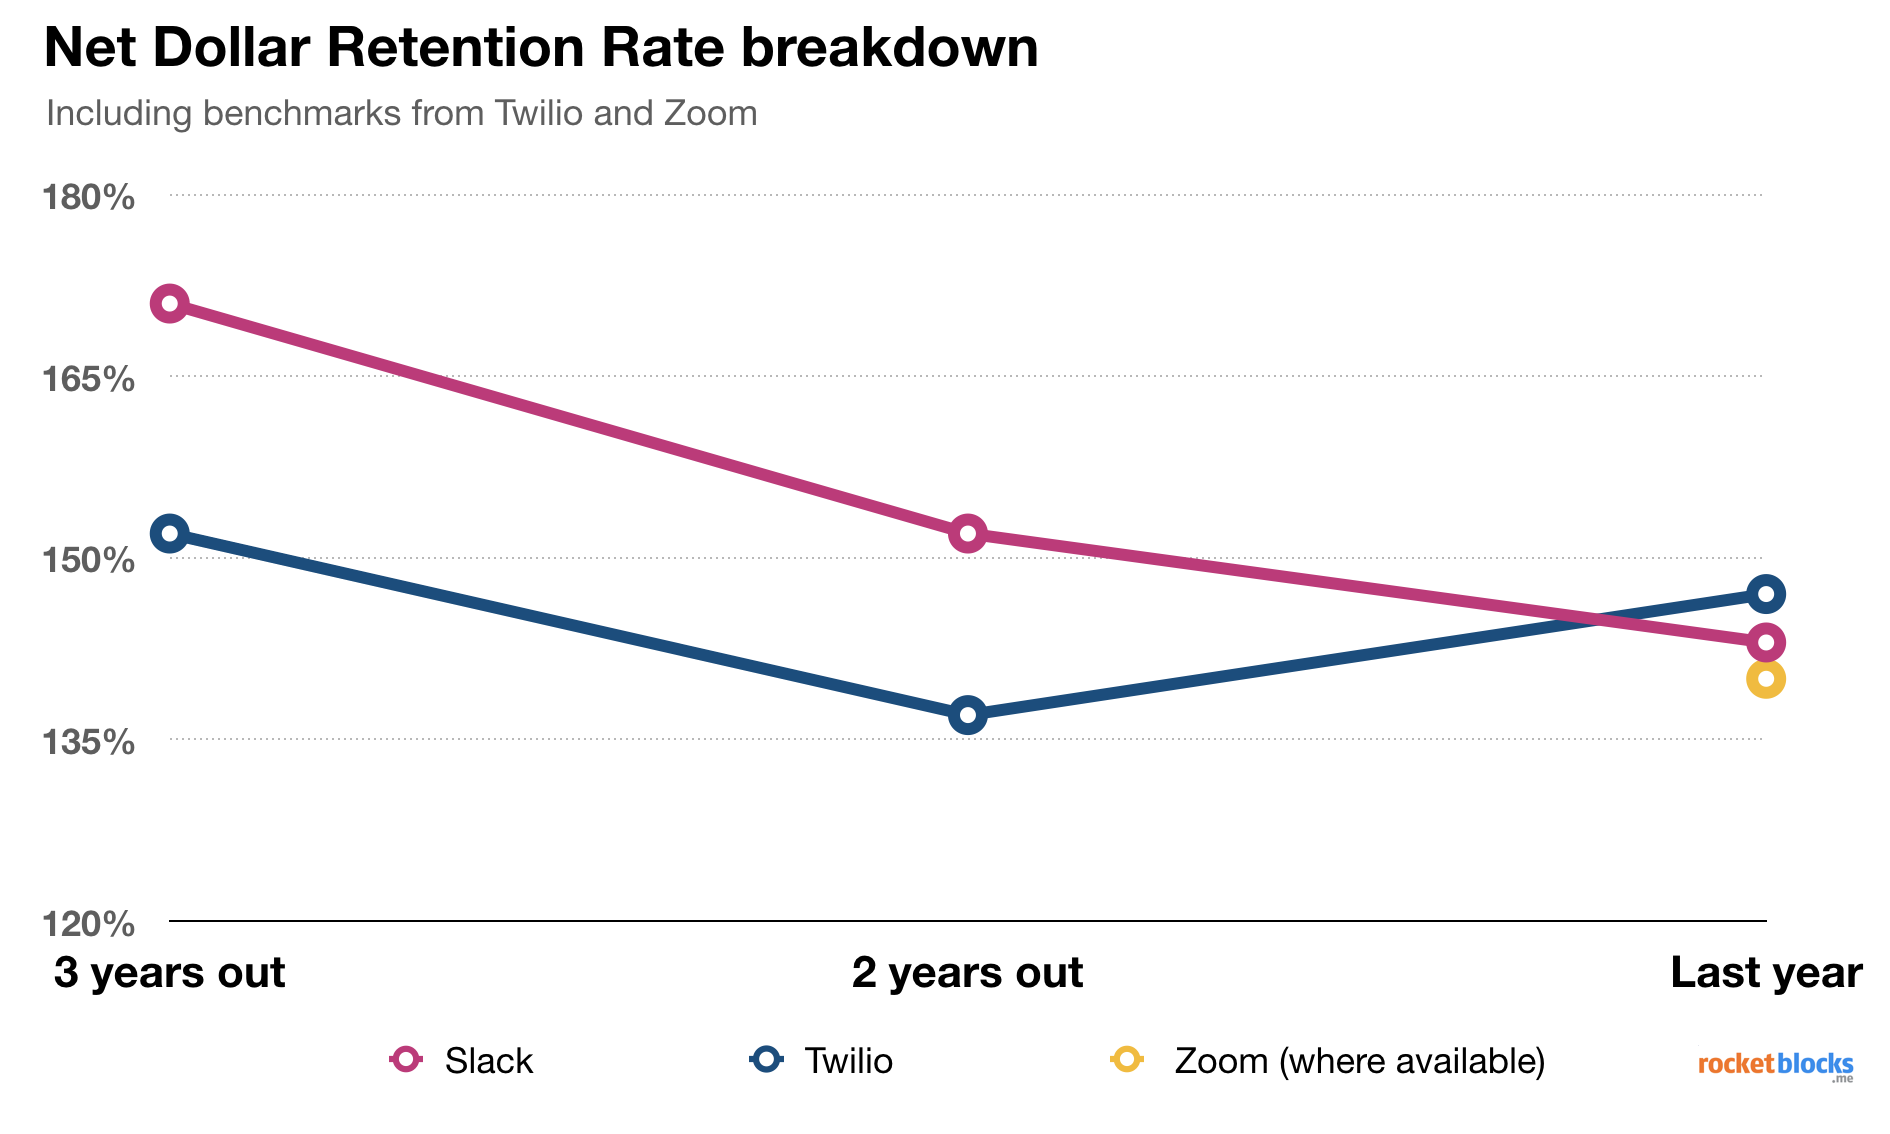
Below, we've plotted Slack's net dollar retention rate (NDRR) against comps from other leading SaaS companies like Twilio and the newly public, Zoom.
NDRR is a metric that attemps to measure whether a company is successful in increasing the monetary value of a specific cohort of users (often a cohort that signed up in a given year, as we show below).
The simple way to read NDRR is that if the number is above 100%, then the company makes more money off the users from that cohort in the current period than they did in the prior period. If NDRR is below 100%, than the opposite is true. For a detailed walk through of the calculation, see below.

Key insights from Slack's NDRR
- The trend of falling NDRR is not great, but on an absolute basis, Slack's NDRR performs in line with other leading SaaS companies like Twilio and Zoom.
- Slack's continued success will likely rely, in large part, on them stablizing NDRR and preventing their downward slide from continuing.
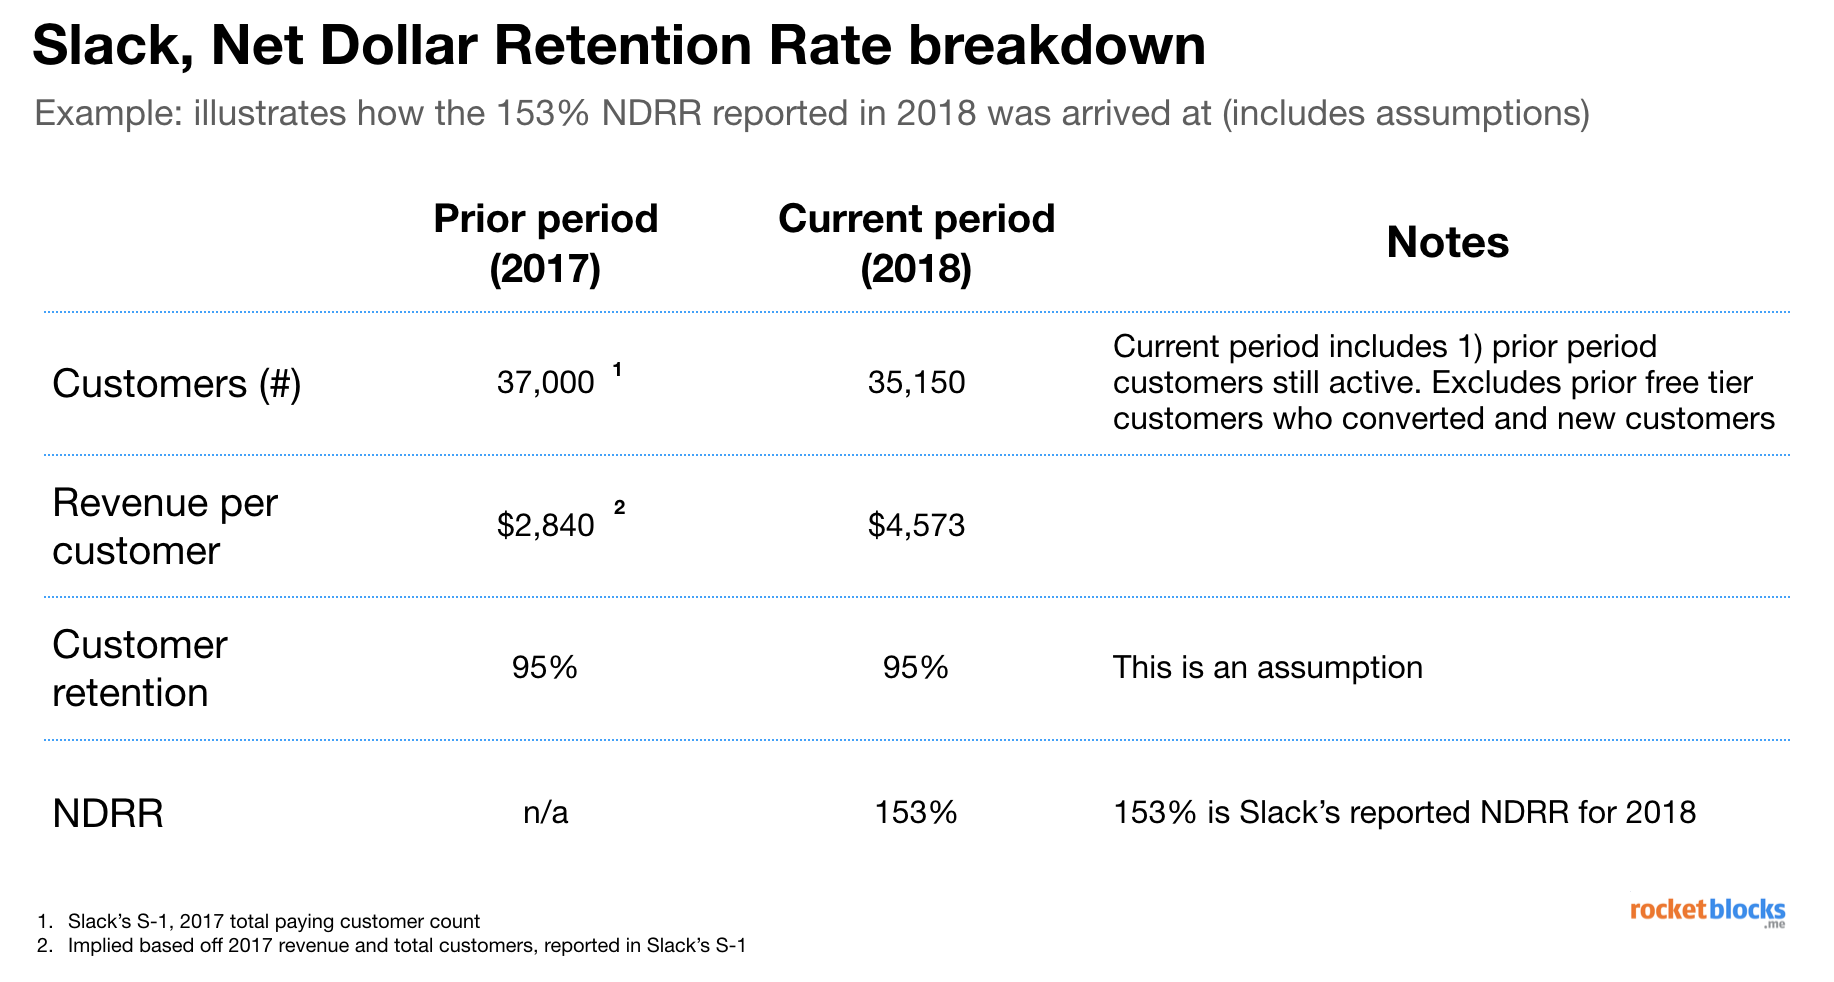
Explaining the net dollar retention rate (NDRR) metric

Understanding the NDRR metric
- NDRR essentially measures how well a company does two things: 1) retains its existing users and 2) increases the value of a retained customer
- Pulling apart NDRR into retention and revenue per customer is illuminating because a company could be great at both, good at one but not the other, or bad at both.
- Understanding these metrics can help product teams focus on shipping features which specifically will help move these numbers in the right direction.
P.S. Are you preparing for PM interviews?
Real interview questions. Sample answers from PM leaders at Google, Amazon and Facebook. Plus study sheets on key concepts.


