Facebook metrics: key benchmarks for PM interviews
|
|
|
If you're interviewing for product management roles at Facebook, it helps to have a strong grasp on the key metrics.
Below, you'll find our FB data pack, sourced from Facebook releases and industry reports and annotated with our commentary and insights. We cover the following:
- DAU trends, from 2009 to 2020
- MAU trends, from 2009 to 2020
- DAU, MAU QoQ growth, from 2009 to 2020
- Daily engagement, from 2009 to 2020
- Quarterly revenues, from 2010 to 2020
- Average revenue per user (ARPU), from 2010 to 2020
Where do metrics show up in PM interviews?
First, the good news. No one is ever going to ask you: "What was Facebook's MAU in Q1 2020?" That's a useless question since it only tests your ability to memorize a fact in isolation.
However, there are many instances in PM interviews where knowledge of relevant benchmarks will be foundation for a deeper discussion. Consider the following interview questions:
- How many photos are uploaded to Facebook each day?
- Propose a feature that will boost Facebook DAU/MAU engagement by 10%.
- How could Facebook grow MAU by 10% QoQ?
In each of the aforementioned questions, understanding the rough benchmarks helps tremendously.
For example, if you didn't know Facebook had roughly 1.5B users per day, where would you start? Or if you didn't know that Facebook DAU/MAU engagement rate was roughly 65% and had stayed flat for years, you wouldn't have any idea that moving engagement up by 10% (whether relative or absolute) would be a monumental task!
Facebook daily active users (DAU), monthly active users (MAU)
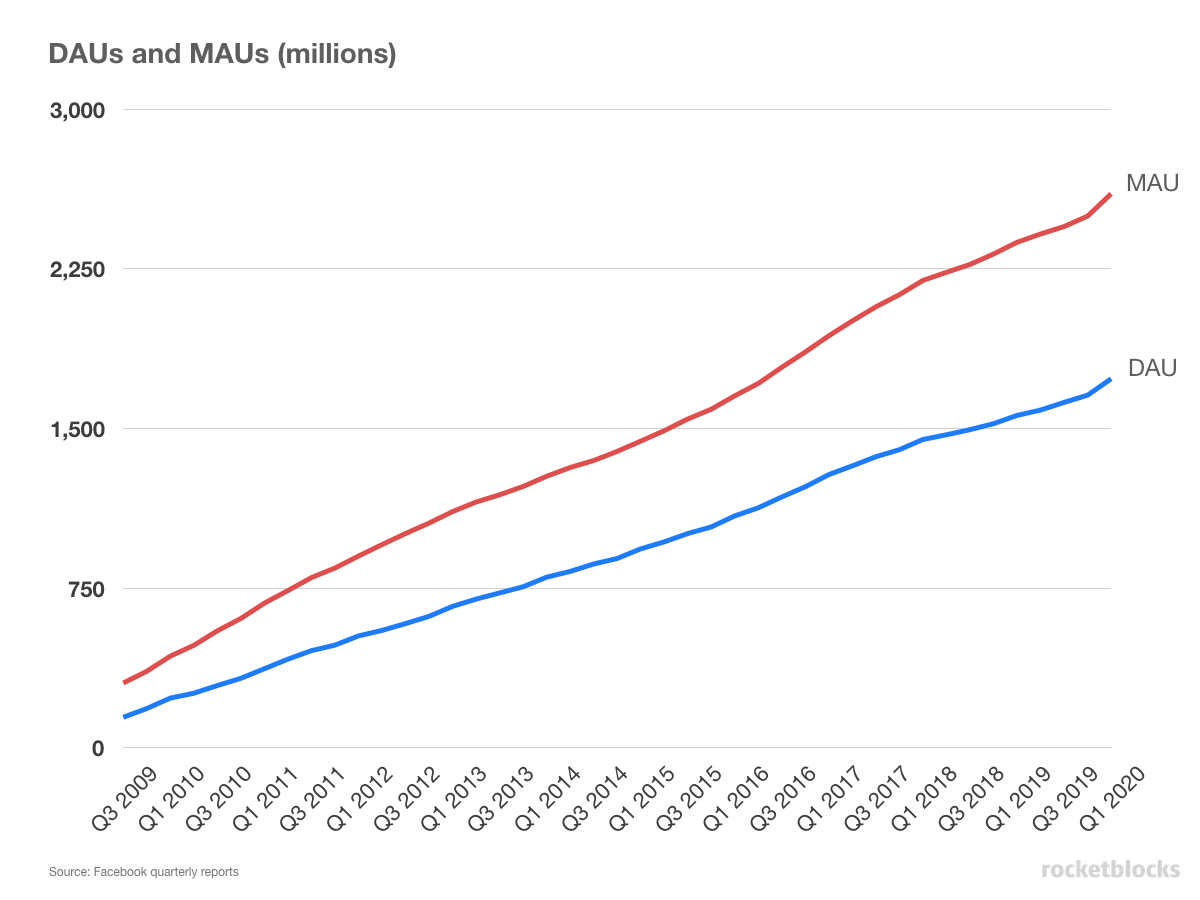
The below chart shows Facebook's DAU and MAU for each quarter, from Q3 2009 and through Q1 2020.
Key FB DAU and MAU take aways:
- Facebook's DAU is massive: approaching 1.75B and still growing, which means roughly 20% of the world's population uses Facebook on any given day.
- Facebook's MAU is massive: 2.6B! Again, as percentage of global population (and more importantly population with internet access), this number is staggering.
- How much DAU and MAU upside is left for Facebook? Looking it forward, it seems that Facebook user growth will evenutally have to slow to the same percentage as growth of internet access.
Facebook daily engagement: the gold standard
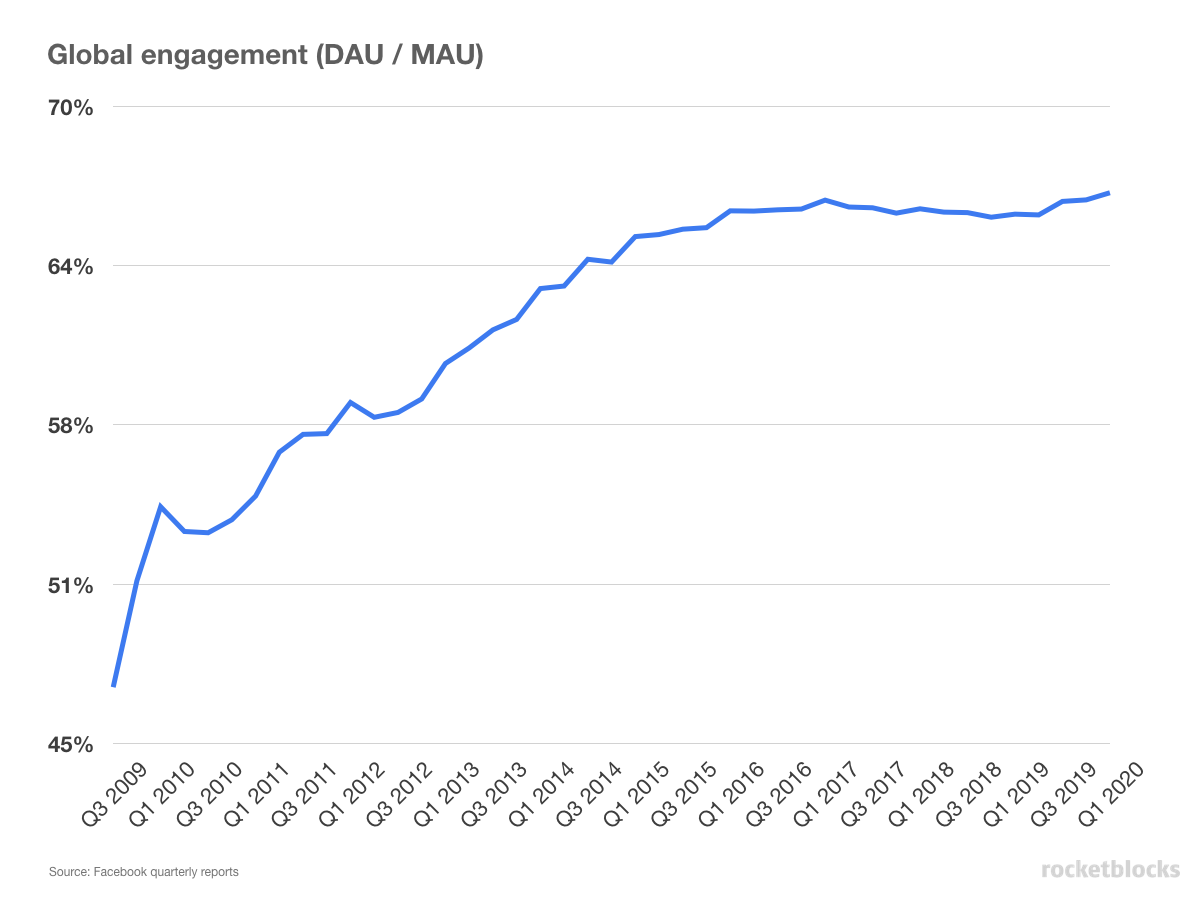
Another key metric that we can derive from Facebook's DAU and MAU numbers is their daily engagement, defined as DAU divided by MAU. This metric provides a sense of how "sticky" a product is by measuring what percentage of monthly visitors show up each day.
Key takeaways from Facebook's engagement trend:
- Overall, the level of daily engagement Facebook sees is impressive, especially since it's on such a wide base of over 2.6B MAUs (i.e., this isn't just a power user trend).
- Between 2010 and 2015, Facebook drove massive positive improvement in engagement, going from roughly 45% to 65% (about 50% in relative lift).
- From mid-2015 to current, daily engagement has been flat at roughly 65%. Given its been there for about 3 years, it's possible 65% represents some natural maximum on engagement for it's current core products.
- What's the next stage of Facebook look like? If DAU and MAU growth slows and engagement stays at 65%, what's act two for Facebook?
Got a FB interview?
"I made it through the gauntlet, and just accepted an offer for a PM role at Facebook! RocketBlocks was the most helpful resource I came across during my preparation by far." -- Tom, Facebook PM
Facebook QoQ DAU and MAU growth
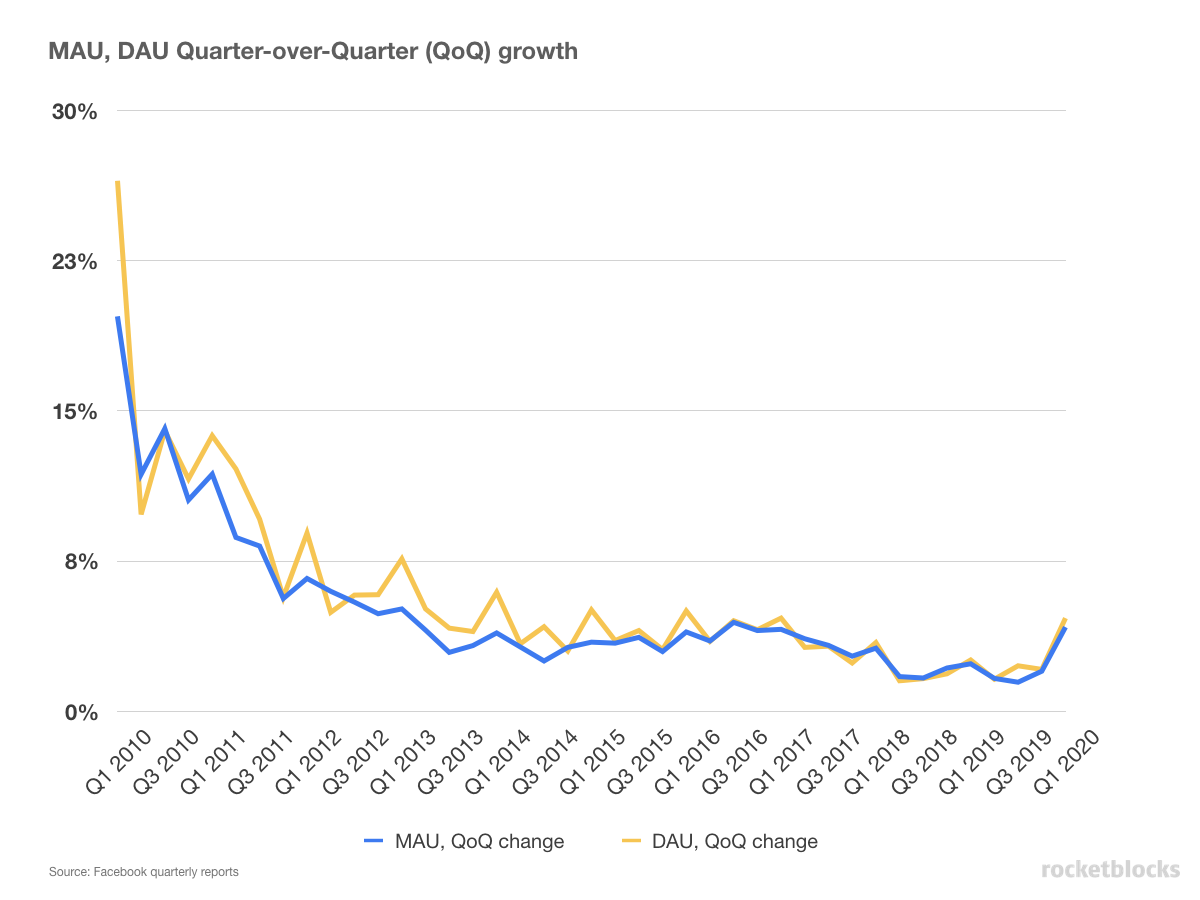
Digging in further, we can look at QoQ growth in both DAU and MAU, which illuminates the pace at which Facebook has been able to grow its user base.
Key insights from the QoQ growth numbers in DAU and MAU
- Overall, this chart illustrates the law of large numbers. It's impossible to grow 10%+ QoQ consistently and Facebook's growth slowdown seems inevitable given how large of an audience they already reach.
- There is a noticeable increase to about 5% growth in both DAU and MAU in the first quarter of 2020, which may be some early impact of covid showing up.
- Even at 2% QoQ growth in DAU, that means Facebook is adding roughly 30M new DAU per quarter. To put that into context, that's like adding 10% of Twitter's MAU in a single quarter.
Facebook revenue trends
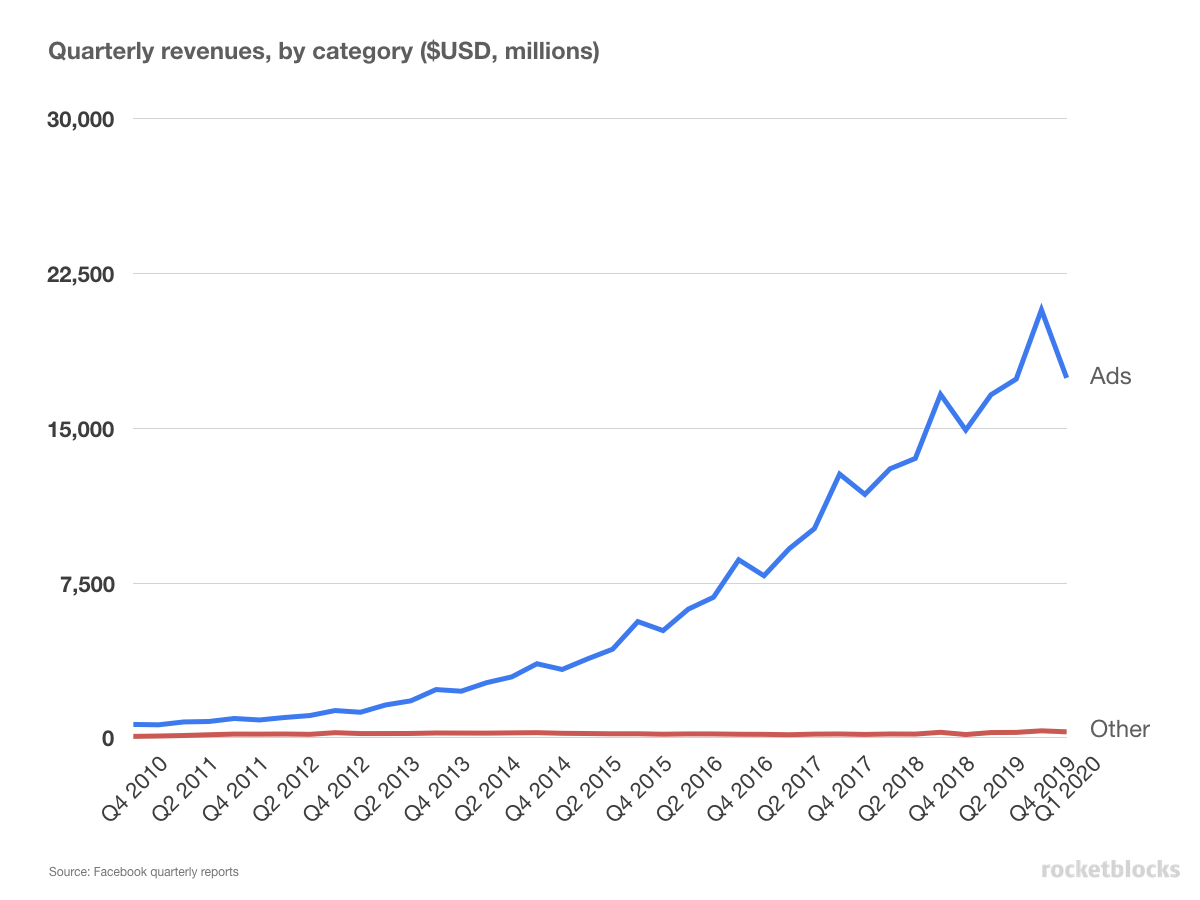
While Facebook's user growth has exhibited a more steady, linear climb over the last five years, Facebook's revenue growth has been on a more exponential growth path.
Key takeaways on revenue trends
- Overall, Facebook's quarterly revenue growth is staggering. They jumped an order of magnitude in less than a decade: from less than $1B in 2010 to $10B per quarter in 2017.
- The evidence of the Q4 splurge in advertising is noticeable - this creates the series of "camel humps" we see in the chart between the Q4 spike, Q1 dip and Q2 recovery that they experience each year.
- If one looks at the user growth and revenue trends together, you can see that Facebook appears to be very good at growing first and then monetizing that growth down the line.
Facebook average revenue per user (ARPU)
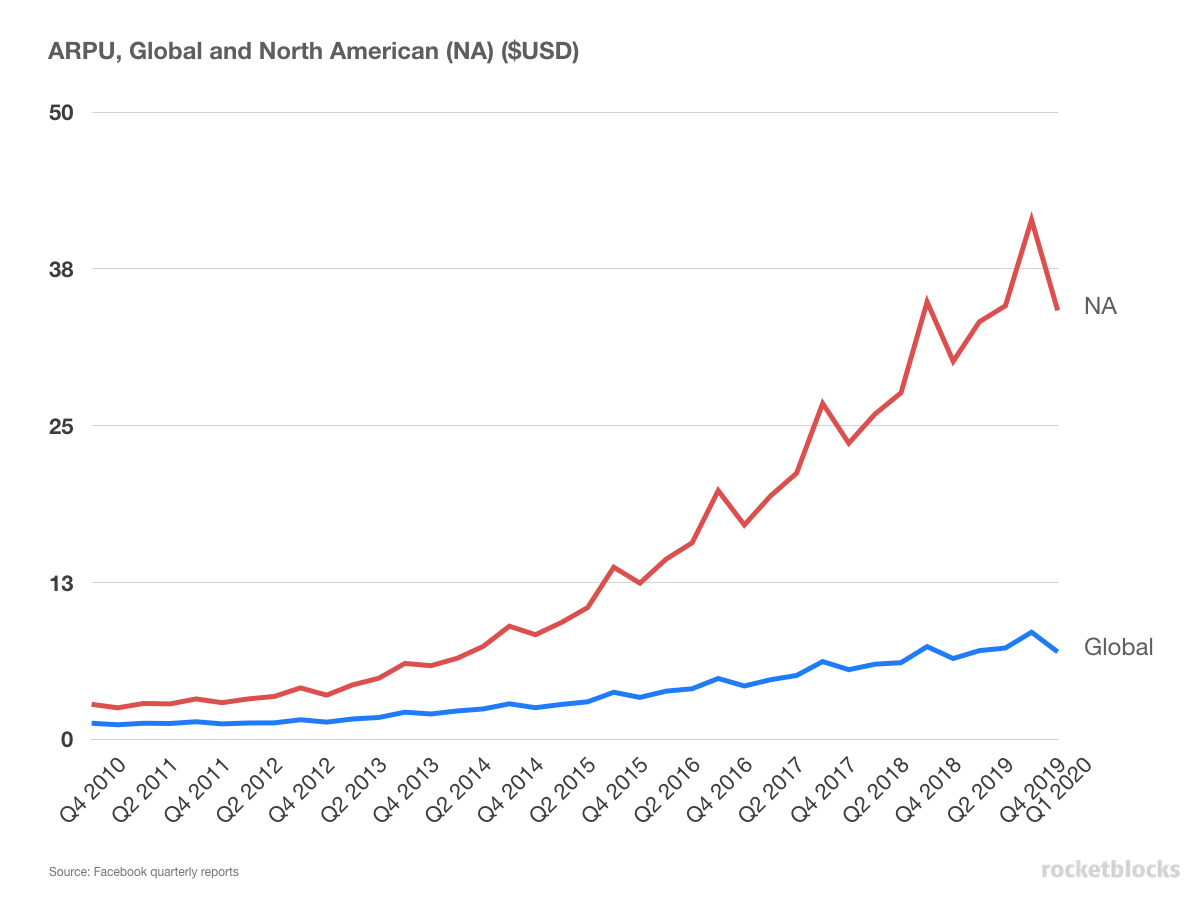
- Facebook's ability to monetize its user base has increased dramatically since 2011, with the average WW user contributing $1 a quarter to over $6 toward mid-2018.
- Growth in ARPU for North American users has been particularly impressive, growing nearly 10x+ from roughly $3 to $40 (at holiday peak).
- Unlike Facebook's user growth, it looks like its ability to monetize its user base is still growing at healthy clip quarter-over-quarter.
Facebook YoY average revenue per user growth (ARPU)
Here we've plotted the year-over-year growth in Facebook's ARPU metrics, which helps illustrates Facebook's increased ability to monetize users and compares the metrics on a YoY basis to control for seasonality.
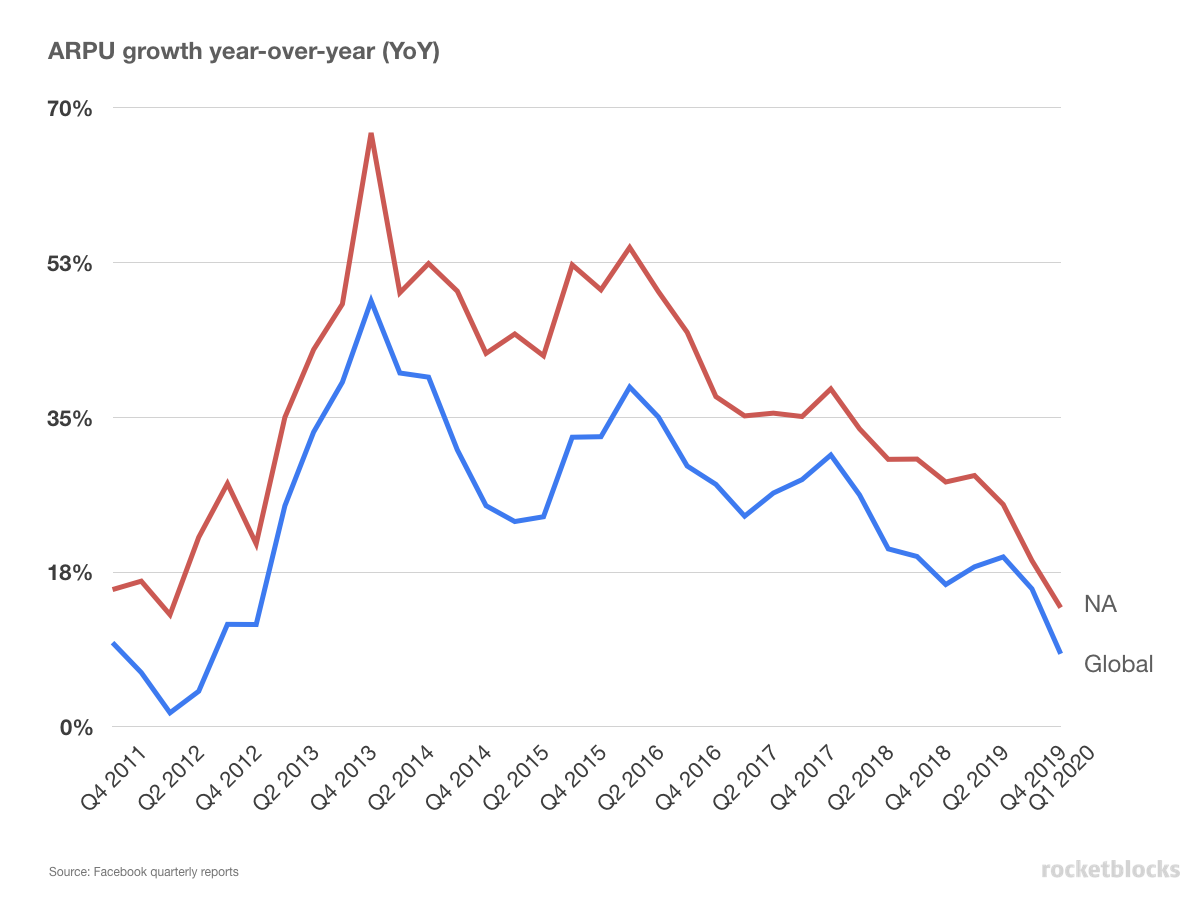
- Overall, Facebook has been able to drive large YoY increases in ARPU and it appears that improvements happen across the geographic base of their users.
- While changes occur across all users worldwide, the ARPU increases tend to be even stronger for the North American users.
P.S. Are you preparing for PM interviews?
Real interview questions. Sample answers from PM leaders at Google, Amazon and Facebook. Plus study sheets on key concepts.
P.P.S. Going deep on Facebook?
Get 35+ pages of in-depth analysis on Facebook's evolution, company and business. Written by PM experts.


