What is the BCG Growth Share matrix?
An overview of the iconic BCG matrix framework
|
|
|
Creation story | Use cases | Example use | Video summary
In this post, we'll do a deep dive into the growth share matrix and explain why it was created, cover the core use cases and demonstrate with an example (using Google's product suite).
The creation of the BCG growth share matrix
The growth share matrix was created by Bruce Henderson, the founder of BCG, in 1970.
At the time, Henderson was looking for a "disciplined and systematic" way to help large companies and conglomerates manage their product portfolios, business units and R&D budgets. Throughout the 70s and 80s, the growth share matrix exploded in popularity and, reportedly, was used by about half of all Fortune 500 companies (according to estimates published in the HBR).
While the matrix is now in middle age, at almost 50 years old, it's as relevant as ever. Older conglomerates like Dupont likely still gain value from its insights, as well as a host of modern tech companies like Amazon, Google and Microsoft which all manage hundreds of different product lines.
How to use the growth share matrix
At its core, the growth share matrix helps large companies make capital and resource allocation decisions.
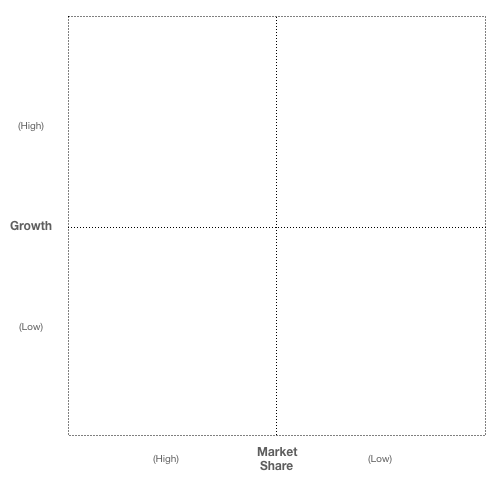
The framework categorizes each product / business line along two dimensions, which helps clarify how the company should think about allocating (or taking) capital and resources to (or from) it.
Given the above, it follows logically that the framework is only useful for multi-business, multi-product companies and conglomerates (sorry startups!). For example:
- Large conglomerates (e.g., Samsung which makes everything from smartphones to cargo ships)
- Multi-product companies (e.g., P&G in the CPG space or Google in tech space)
Two dimensions: market attractiveness and company competitiveness
Here's how BCG defines the matrix:
The matrix helped companies decide which markets and business units to invest in on the basis of two factors: company competitiveness and market attractiveness
BCG
However, measuring both those factors - company competitiveness and market attractiveness - is tough, so BCG simplified the framework by using quantifiable proxies.
For market attractiveness, BCG substituted in the market growth rate, which is measurable and indicates attractiveness (e.g., all things equal, a fast growing market will create more opportunity).
For company competitiveness, BCG substituted the company's market share in that product line or business (e.g., if a company has a commanding market share, they must be competitive in that space and vice versa).
The final simplification is to rank each product (or business) on each dimension: high or low.
The market attractiveness dimension
This dimension tracks the growth rate of the overall market that the product or business is within. For example, if the market was growing at 20% a year that would likely be considered "High." If it were growing at 2% a year that would be considered "low."
The company competitiveness dimension
This dimension captures the estimated market share the product (or business) currently has. For example, if a product had a 40% share in its category, that would likely be categorized as high. Conversely, if a product had a 15% share of the market it's within, that'd be considered low.
Got a BCG interview?

"RocketBlocks was a key component of my success in securing consulting offers from the top 3 consulting firms. I can't recommend its tools enough." -- David Dance, BCG Project Leader
Four types of products and/or businesses
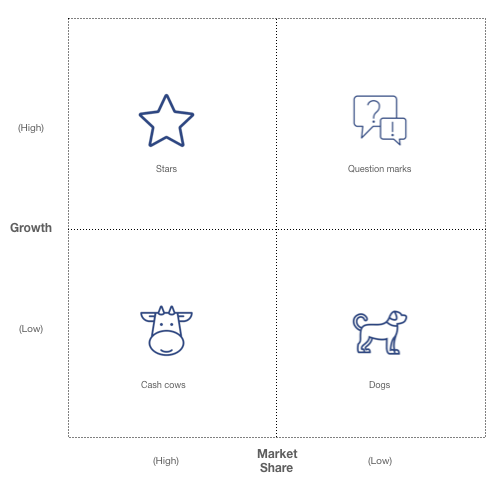
#1: Dogs
Products / businesses which are operating in low growth markets and currently have a low market share within those markets. As the name implies, these businesses aren't going to make the business rich, but they might be good targets to shut down or divest. Shedding these business could generate some cash (e.g., someone else acquires it) and increase focus.
#2: Question marks
Products / businesses which are operating in high growth markets and currently have a low market share within those markets. These are "question marks" because the market is attractive but the company hasn't gained a meaningful foothold yet. Thus, the question is: should we invest more to gain a foothold or cut our losses?
#3: Stars
These are, as the name implies, the eponymous ones (the Stars!). They're in high growth markets which are attractive and the market share obtained within them is high - an enviable position for any company. Thus, companies often focus heavily on these businesses and reinvest in them aggressively to maintain and/or strengthen their position.
#4: Cash cows
These are the stable money makers. While they're not in high growth markets, the market share obtained within those markets is high and they generate lots of cash which can be reinvested elsewhere. They might be slow moving like a cow, but they've got plenty of cash to help other businesses grow.
Example of applying the growth share matrix
Consider a company like Google.
Google has numerous business units under its Alphabet, Inc. holding company (e.g., AdWords, Fi, Android, YouTube, Waymo, X, Verily, etc.) and hundreds of different products, each at different stages of their product lifecycle.
As Google makes capital allocation decisions, it could use the growth share matrix. For example, Google's long standing advertising units such as AdWords and AdSense might be viewed as a hybrid between a Star and Cash Cow (Google is an envious position here where those are dominant businesses, still growing fairly quickly and already throw off tons of cash).
Thus, while Google is likely reinvesting heavily in those businesses since they aren't pure Cash Cows just yet, it's certainly taking cash from those businesses and using it to invest further into existing Stars, like YouTube, and Question marks, like its speculative self-driving car unit. In fact, Google's reorganization into the Alphabet holding company in 2015 points to its own realization that it needs to manage its business like a portfolio.
Finally, we've also seen evidence of Google divesting itself of various Dogs in its portfolio. For example, Google sold SketchUp, a 3D modeling software product, to Trimble in 2012, Motorola to Lenovo in 2014 for $2.91B and Zagat, a restaurant reviews company it had previously acquired, in 2018.
Video overview of the BCG growth share matrix
Below, our Founder, Kenton Kivestu, provides an overview of the BCG growth share matrix, complete with a description of each quadrant and how the matrix might be used for capital allocation.
P.S. Are you preparing for consulting interviews?
Real interview drills. Sample answers from ex-McKinsey, BCG and Bain consultants. Plus technique overviews and premium 1-on-1 Expert coaching.


